
The Bureau of Labor Statistics recently released its latest national survey of employment and wage data. The report includes state- and metro-level wage figures for a range of culinary occupations, including various types of cooks and chefs.
According to the latest data set available, the average cook in the United States earned $35,950 per year, or $17.28 per hour in 2024. The BLS distinguishes between types of establishments and skill levels. Line cooks—typically employed in standard restaurants—earned slightly more, at $37,730 annually or $18.14 per hour. In contrast, cooks working in fast food establishments earned significantly less, averaging $31,140 per year or $14.97 per hour.
As expected, head cooks and chefs earned the highest wages, with an average annual salary of $64,720, or $31.11 per hour.
The average pay for cooks in the United States is $17 per hour, a quarter of all cooks earn $14 or less. Similarly, 25% of all chefs and head cooks in the U.S. earn less than $23 per hour, while the top 10% earn over $46.
Averages only tell part of the story, but fortunately, the BLS provides some additional insights. While the average pay for cooks in the United States is $17 per hour, a quarter of all cooks earn $14 or less, while the top 25% earn $19 or more.
Similarly, about a quarter of all chefs and head cooks in the U.S. earn less than $23 per hour, while the top 10% earn over $46. We’ll delve deeper into this in a future story.
How Much a Chef Earns Depends Heavily on Where They Work
National averages are a great way to get a general sense of the industry, but a cook’s earnings depend not only on skill level, position, and experience—but just as much on which state and city they work in.
Let’s start with the state-level data released by the Bureau of Labor Statistics. The national average pay for line cooks (i.e., restaurant cooks) is $37,730 annually or $18.14 per hour. However, cooks in West Virginia, Arkansas, Louisiana, and Mississippi earn $30,000 or less per year, while those in Hawaii, Massachusetts, Maine, and Washington earn $44,000 or more.
Chef state-level earnings data show a slightly different picture. The lowest-paying states for chefs are Louisiana, South Dakota, and Iowa, while the top-paying states are Massachusetts, Rhode Island, and Hawaii. Also, check the table below for the full dataset.
State
Annual Salary ($)
Hourly Wage ($)
Louisiana44,94021.61
South Dakota47,90023.03
Iowa48,63023.38
Mississippi50,15024.11
Utah50,40024.23
Oklahoma51,42024.72
Kentucky51,80024.91
Idaho54,94026.41
Texas55,13026.51
Arkansas56,45027.14
Maine57,55027.67
Georgia57,97027.87
Montana58,09027.93
Michigan59,17028.45
Indiana60,19028.94
Ohio60,70029.19
New Mexico60,75029.21
Alaska60,81029.23
Kansas60,92029.29
New Hampshire61,37029.51
Virginia62,12029.86
Nevada62,14029.87
Missouri62,18029.89
Tennessee62,21029.91
Wisconsin62,30029.95
Pennsylvania62,50030.05
Florida62,54030.07
Illinois63,36030.46
Oregon63,72030.64
Minnesota63,80030.67
Alabama63,80030.67
South Carolina64,05030.79
Maryland64,13030.83
West Virginia65,15031.32
Arizona65,93031.70
North Carolina66,33031.89
Nebraska66,69032.06
Delaware67,33032.37
Vermont68,65033.00
Wyoming69,51033.42
New York70,20033.75
North Dakota71,28034.27
California71,35034.30
Washington71,43034.34
Connecticut71,63034.44
New Jersey75,02036.07
Massachusetts75,90036.49
District of Columbia79,09038.02
Rhode Island87,95042.28
Hawaii92,69044.56
Salaries vary significantly from state to state. So, if you’re trying to understand how well you’re paid—or how much you could earn as a cook—it’s essential to look at local wage data. Below, you’ll find a map and table showing wages and salaries for chefs, line cooks and fast food cooks in every U.S. state.

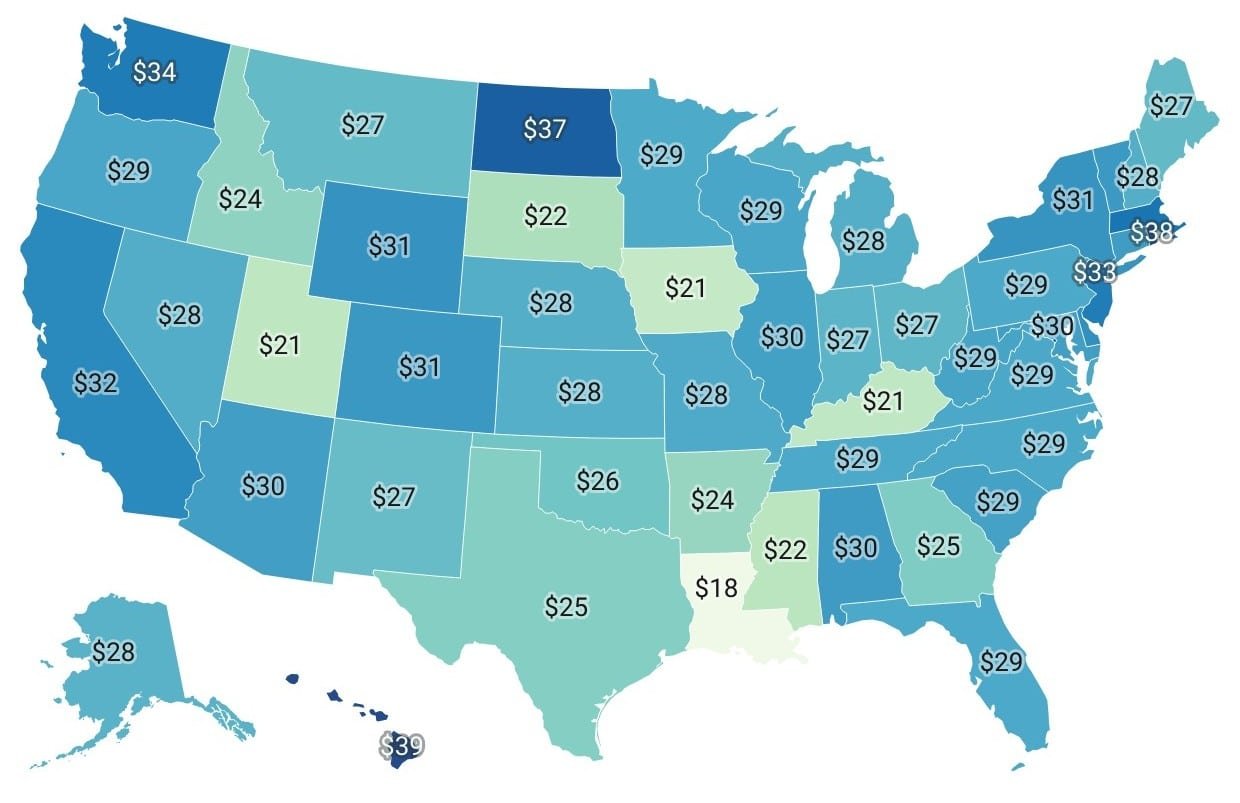
The map below shows the median hourly pay for line cooks in each state.

The map below shows the median hourly pay for cooks working in fast food restaurants in each state.

The map below shows the median hourly pay for chefs and head cooks in each state.

Significant Pay Disparities at the Metro Level
Wage differences don’t stop at the state level. Just like real estate prices and the cost of living, pay can vary widely within the same state. Working at a Michelin-starred restaurant in New York can earn you substantially more than working in a luxury hotel in Buffalo, NY. For example, chefs in Bakersfield, CA, earn an average of $62,500, while their counterparts in San Jose make nearly $80,000.
Line cooks in metro areas such as Hawaii, San Jose, San Francisco, Seattle, and Napa are among the highest paid in the country, with annual wages reaching up to $50,000. In contrast, line cooks in cities like Laredo, TX; Alexandria, LA; Hammond, LA; Brownsville-Harlingen, TX; and Monroe, LA earn well below the national average.
Use the table below to explore how much cooks and chefs are paid in your area.
Wage Gap Between Chefs and Cooks Narrows
Pay for line cooks and other kitchen staff increased modestly during the first two decades of the 2000s, with annual wage growth of around 1% being quite common. For example, between 2009 and 2015, pay for line cooks rose by just 5.7% over the full six-year period. In contrast, pay increases were substantially higher for chefs and head cooks, so by the early 2010s, chef wages were roughly double those of line cooks and about 1.5 times higher than fast food cooks.
However, this trend shifted significantly after the pandemic, as wages for line cooks and fast food cooks rose sharply—outpacing the growth in pay for head chefs.

In 2011, chefs and head cooks were earning almost twice as much as line cooks and about 1.5 times more than fast food cooks. By 2024, the wage gap had narrowed, with chefs earning 71.5% more than line cooks and 107.8% more than fast food cooks. The post-pandemic years were marked by a significant shortage of kitchen staff, which put upward pressure on wages—especially for lower- and mid-skilled kitchen positions.

Related: States with the Highest Share of Fast Food Cooks